

Evacuation Impacts
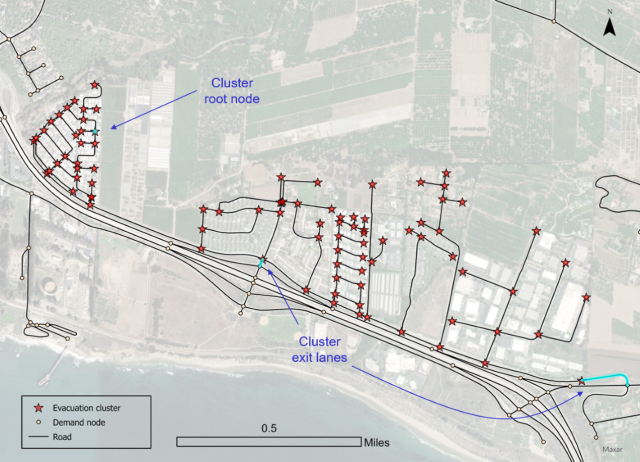
WRI researchers have developed spatial analytics to identify potential evacuation neighborhoods and their road exits in the Santa Barbara region. These neighborhood exits represent expected bottlenecks during a hazard evacuation event. The significance of these neighborhoods is based on their total residential population divided by the resulting number of exit lanes. Identified neighborhoods therefore represent the highest ratios of population in the region.
We face a frightening range of hazards every day. While many threaten and/or impact large regions, most hazard events do not. Rather, they affect only a local area such as neighborhood or community. Many regions face almost daily evacuation orders for one or more neighborhoods. In such cases authorities, residents and visitors must know the time required to vacate a neighborhood, and where they need to go in order to escape danger. Evacuation then is the process of moving the fewest number of people necessary to the closest location(s) providing safety from the hazard.
Successful evacuation of an area requires planning and contingencies. An essential first step is identifying areas that may need to be vacated. Most counties have predefined evacuation zones that are generic in nature, often not specified on the basis neighborhoods nor any inherent spatial structure imposed by the transportation network. The reality, however, is that bottlenecks exist in the transportation system that limit egress (and ingress) and evacuation clearing time. Knowing these bottlenecks is important for ensuring traffic movement, and enables mitigation measures to be devised to ensure the effective and safe clearing of those in a threatened neighborhood or community. Such measures may include more lead time in issuing an evacuation order but also stationing first responders and/or emergency personnel to facilitate the flow of people out of an area. Additionally, infrastructure improvements and hardening to bottleneck segments may also be prudent.
The significance of evacuation egress for neighborhoods located in high risk of hazard areas is recognized in public policy. For example, Senate Bill 99 (2019) amended California Government Code Section 65302 to require residential developments in high fire hazard severity zones to have at least two emergency evacuation routes in order to enhance egress safety. Similarly, Senate Bill 571 (2023) amended California Government Code Section 65040.25 to require state and local agencies to evaluate and improve evacuation egress and ingress in the event of a natural disaster, specifically addressing evacuation travel capacity associated with an area. Communities are now effectively mandated to undertake analysis, yet identifying those neighborhoods where there are egress limitations remains a challenge.
Interactive Website
The interactive site displays evacuation clusters by their residential population divided by number of limiting exit lanes across the Santa Barbara region.


Empirical Assessment
Technical details and a description of the methodology are given in Murray (2025). The basic idea is identifying an area that is restricted in terms of evacuation capability. As an example, this map highlights portions of Isla Vista / UCSB, an area that has a population of 24,448. The indicated area has three single lane exits: Storke Rd (north of Sierra Madre Ct), Los Carneros Rd (north of Mesa Rd) and 217 (exiting UCSB). This gives an evacuation load of 8,149 people per lane (24,448 / 3), by far the highest observed in the Santa Barbara region.
Other noteworthy neighborhoods/communities that are vulnerable to road network bottlenecks, should evacuation be necessary, West Goleta (Ellwood, El Encanto Heights), South Carpinteria (Memorial Park, Monte Vista Park, Carpinteria Creek), and Mission Canyon.

The Mission Canyon area is another example of recognized high wildfire risk neighborhood. It has a residential population of 2,134 and is limited to two exit lanes (Foothill Rd, Mountain Dr). This corresponds to 1,067 people per exit lane. Interestingly, network topology suggests two extra exits on Las Canoas Rd and Foothill Ln, making the bulk lane demand 533 people per exit lane, but those two would not be viable for a wildfire hazard.
El Encanto Heights area in Goleta has up to five exit lanes (Cathedral Oaks Rd, Calle Real, Del Norte Dr). However, it has a residential population of 7,148, which results in 1,430 people per exit lane.

Note that these are preliminary findings based on interpolated 2020 US Census block data. Further, we have observed irregularities in the associated transportation network data, so are actively working to correct them and report updated figures.
References
- Murray (2025). Critical neighborhood evacuation area identification. Journal of Transport Geography, 128, 104325.
- Murray & Zheng (2026). Neighborhood hazard evacuation bottlenecks. Journal of Geographical Systems.
Background Information
- Cova & Church (1997), Modelling community evacuation vulnerability using GIS. International Journal of Geographical Information Science, 11(8), 763-784
- Church & Cova (2000). Mapping evacuation risk on transportation networks using a spatial optimization model. Transportation Research Part C: Emerging Technologies, 8(1-6), 321-336.
Contact

Neighborhood Evacuation Summary Handout